Energy Access
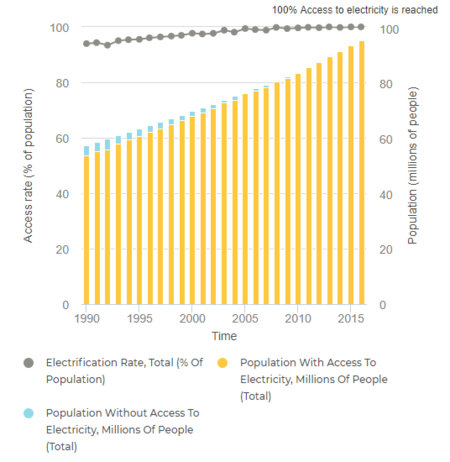
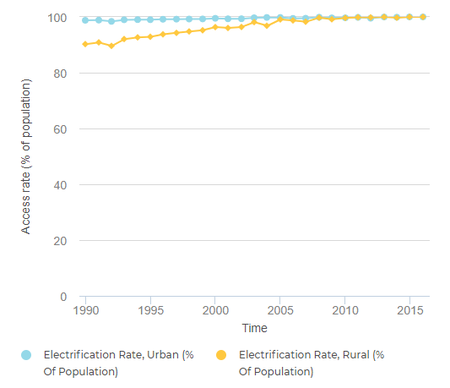
According to the latest Tracking SDG7 Report on The Energy Progress, that was jointly prepared by:International Energy Agency (IEA), International Renewable Energy Agency (IRENA), United Nations Statistics Division, World Bank Group and World Health Organization, the state of energy access through Egypt is illustrated through the following table and figures[8]:
The report shows that since around 2014/2015, the total Egyptian population has had access to reliable energy sources, and only 2% of the whole population has no access to clean cooking.
Table.2: Percentage of Egyptian Population's Access to Electricity & Clean Cooking
| Access to | ||
|---|---|---|
| Electricity | Clean Cooking | |
| % of Population | 100% | 98% |
Production
Table.3: Egypt’s Production of Different Energy Sources during the 2000s
| 2000 | 2005 | 2012 | 2013 | 2014 | 2015 | 2016 | 2017 | |
|---|---|---|---|---|---|---|---|---|
| Coal | 20 | 14 | 0 | 0 | 0 | 0 | 0 | 0 |
| Crude Oil | 33189 | 30111 | 32142 | 29537 | 32825 | 33210 | 30835 | 31885 |
| Natural gas | 18555 | 35901 | 54839 | 50143 | 39084 | 34763 | 34763 | 35362 |
| Electricity from Fossil Fuels | 5302 | 8211 | 12250 | 12250 | 13431 | 14355 | 14514 | 14679 |
| Hydro Electricity | 1260 | 1087 | 1112 | 1113 | 1188 | 1155 | 1171 | 1187 |
| Electricity from Renewable | 12 | 47 | 139 | 139 | 145 | 137 | 150 | 165 |
| Refinery/Oil Products | 23449 | 28561 | 24754 | 21836 | 25348 | 25676 | 26357 | 270565 |
Installed Capacity
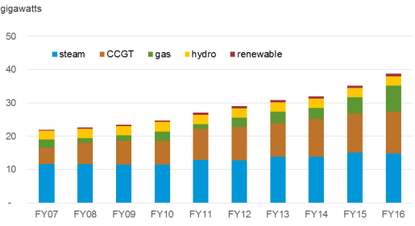
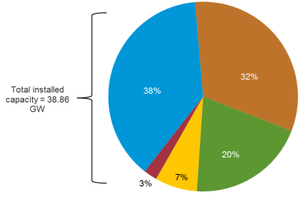
With accordance to the EIA's report on Egypt (2018), the following graph and pie-chart highlight the installed capacity of different energy sources in the country from 2007-2016 in terms of fiscal years.
to be continue......... |


No comments:
Post a Comment