Energy Security
Renewable Energy
General Data
Table.15: Egyptian Renewable Energy Production since 1965 in Twh
| Year | 1965 | 1975 | 1985 | 1995 | 2000 | 2005 | 2010 | 2015 | 2016 | 2017 |
|---|---|---|---|---|---|---|---|---|---|---|
| Produced Capacity | - | - | - | - | .1 | .5 | 1.4 | 1.9 | 2.6 | 2.7 |
Table.16: Egyptian Renewable Energy Consumption since 1965 in Mtoe
| Year | 1965 | 1975 | 1985 | 1995 | 2000 | 2005 | 2010 | 2015 | 2016 | 2017 |
|---|---|---|---|---|---|---|---|---|---|---|
| Consumed Capacity | - | - | - | - | - | .1 | .3 | .4 | .6 | .6 |
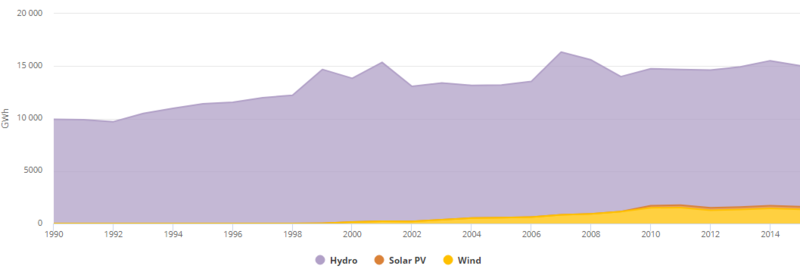
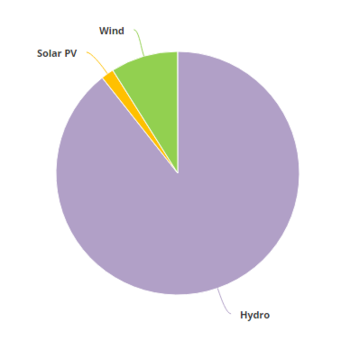
In 2012, electricity production from renewable energy sources reached 14,855 GWh, which is a share of 9.04% of the total electricity production. While 13,358 GWh (8.13%) were produced by hydro power installations, wind power contributed another 1,260 GWh (0.77%) and solar PV 237 GWh (0.14%).
Hydro
Table.17: Egyptian Hydro-Generation since 1965 in Twh
| Year | 1965 | 1975 | 1985 | 1995 | 2000 | 2005 | 2010 | 2015 | 2016 | 2017 |
|---|---|---|---|---|---|---|---|---|---|---|
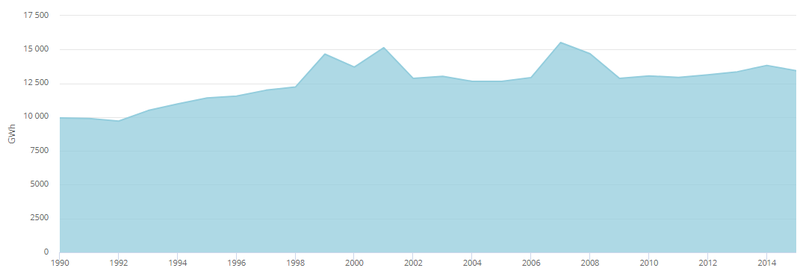
| Generated Capacity | 1.7 | 6.8 | 9.1 | 11.2 | 14.2 | 12.6 | 13 | 13.7 | 13.3 | 13.4 |
Table.18: Egyptian Hydro-Consumption from since 1965 in Mtoe
| Year | 1965 | 1975 | 1985 | 1995 | 2000 | 2005 | 2010 | 2015 | 2016 | 2017 |
|---|---|---|---|---|---|---|---|---|---|---|
| Consumed Capacity | .4 | 1.5 | 2.1 | 2.5 | 3.2 | 2.9 | 2.9 | 3.1 | 3 | 3 |
The latest estimates of the hydro power installed capacity are approximately 2842 MW, accounting for about 7.2-9% of the total generated mix. Also, the ongoing implementation of 32 MW hydropower project in Assiut and a 2400 MW pumping and storage plant in Attaqa-Suez, that is supposed to be operating by 2022, according to the Egyptian Ministry of Electricity and Renewable Energy & the Egyptian Holding Electricity Company
Table.19: Egypt's Hydroelectric Plants
| Operator | Commissioning Date | Installed Capacity (MW) |
|---|---|---|
| High Dam | 1967 | 2100 |
| Aswan Dam 1 | 1960 | 280 |
| Aswan Dam 2 | 1985/86 | 270 |
| Esna | 1993 | 86 |
| Nag' Hamadi | 2008 | 64 |
Wind
Table.20: Egyptian Wind-Power Generation since 1965 in Twh
| Year | 1965 | 1975 | 1985 | 1995 | 2000 | 2005 | 2010 | 2015 | 2016 | 2017 |
|---|---|---|---|---|---|---|---|---|---|---|
| Generation Capacity | - | - | - | - | .1 | .5 | 1.4 | 1.9 | 2.5 | 2.5 |
Table.21: Egyptian Wind-Energy Consumption since 1965 in Mtoe
| Year | 1965 | 1975 | 1985 | 1995 | 2000 | 2005 | 2010 | 2015 | 2016 | 2017 |
|---|---|---|---|---|---|---|---|---|---|---|
| Consumed Capacity | - | - | - | - | - | .1 | .3 | .4 | .6 | .6 |
Egypt is endowed with abundant wind energy resources, with many coastal regions, where high and stable wind speeds are frequent, especially in the Gulf of Suez and the Nile Valley, as wind speed could reach 10.5 m/s at 50 meter height.
Table.22: Egyptian Wind Indicators
| Indicator | Installed Capacity | Generated Energy | Fuel Savings | CO2 Reductions | Potential Capacities |
|---|---|---|---|---|---|
| Value | 750-753 MW | 12600 GWh | 2.7 Mtoe | 6.8 Million Tons | 30000 MW |
Table.23: Egyptian Major Wind Farms
| Farm | Za'farana | Gebel El-Zeit | Hurghada |
|---|---|---|---|
| Generated Capacity | 547 MW | 200 MW | 5 MW |
Solar
Table.24: Egyptian Solar Production since 1965 in Twh
| Year | 1965 | 1975 | 1985 | 1995 | 2000 | 2005 | 2010 | 2015 | 2016 | 2017 |
|---|---|---|---|---|---|---|---|---|---|---|
| Procution Capacity | - | - | - | - | - | <.1 | .1 | .1 | .1 | .2 |
Table.25: Egyptian Solar Consumption since 1965 in Mtoe
| Year | 1965 | 1975 | 1985 | 1995 | 2000 | 2005 | 2010 | 2015 | 2016 | 2017 |
|---|---|---|---|---|---|---|---|---|---|---|
| Consumption Capacity | - | - | - | - | <.1 | <.1 | <.1 | <.1 | <.1 | <.1 |
Though solar energy use in the country is still in its infancy, yet the country has a great potential in the solar sector. With accordance to the EIA's latest report, the country only has 30 MW of installed solar capacity so far[5]. Additionally, there is one solar thermal project, an integrated solar combined-cycle power plant. Here, the solar power partially replaces fossil fuel. The plant has an overall capacity of 140 MW, of which the solar input is 20 MW. More PV projects are in the pipeline, one in Hurghada (20 MW, expected start of operation 2016), and one in Kom Ombo (20 MW, expected the start of operation 2016).[19]
Also, the Egyptian government has a huge scheme to boost the solar sector by installing a 1.8 GW solar park, which to be developed in Benban. As part of reaching that goal, the Egyptian government has closed two deals on two different fronts; the 1st is with Norway's Scatec Solar to build six solar photo voltaic plants with a combined capacity of 400 MW, while the 2nd is with Saudi firma Acwa for another three solar photo voltaic plants with a capacity of 120 MW.
Table.26: Egyptian Solar Potential Indicators
| Indicator | Direct Solar Radiation | Sunshine Duration | Potential Capacities |
|---|---|---|---|
| Value | 2000-3000 kWh/m2/year | 9-11 hours/day | >50000 MW |


