Electricity
General Data
Table.9: The General Electricity Situation in Egypt
| Electricity | ||||||||||
|---|---|---|---|---|---|---|---|---|---|---|
| Production | Consumption | Exports | Imports | Installed Generating Capacity | ||||||
| Rate | 171.9 billion kWh | 150.4 billion kWh | 1.158 billion kWh | 43 million kWh | 38.88 million kWh | |||||
| World Ranking | 24 | 25 | 57 | 106 | 27 | |||||
Electricity Access
According to the U.S. Central Intelligence Agency (CIA)'s 2018 report, only around 300,000 people of the whole Egyptian population is currently without access to electricity.
Table.10: Electrification Percentages in Egypt
| Electrification | |||
|---|---|---|---|
| Total Population | Urban Areas | Rural Areas | |
| % | 99.6 | 100 | 99.3 |
Installed Capacity and Generation
Table.11: Percentages of Different Electricity-Generating Energy-Sources in Egypt
| Electricity Generated From: | ||||
|---|---|---|---|---|
| Fossil Fuels |
Nuclear Fuels
| Hydroelectric Plants | Other Renewables | |
| % of the Total Installed Capacity | 90.5 | 0 | 7.3 | 2.2 |
| World Ranking | 58 | 83 | 125 | 115 |
Between 2011/2012 and 2012/2013, the total installed capacity increased about 6 %, reaching 30,803 MW, due to added thermal plants. The installed capacity development by type of generation since 2008 is outlined in table 12.
Table 12: Installed capacity development by type of generation (in MW) 2008-2013
| 2008/2009 | 2009/2010 | 2010/2011 | 2011/2012 | 2012/2013 | |
| MW | |||||
| Renewable | 425 | 249 | 687 | 687 | 687 |
| Steam | 11,458 | 11,458 | 12,859 | 12,684 | 13,808 |
| Hydro | 2,800 | 2,800 | 2,800 | 2,800 | 2,800 |
| Combined Cycle | 7,178 | 7,137 | 9,327 | 10,077 | 10,080 |
| Gas | 1,641 | 2,841 | 1,376 | 2,826 | 3,428 |
| Total | 23,502 | 24,762 | 27,049 | 29,074 | 30,803 |
In addition, Egypt has 30 decentralized power plants, mostly diesel and gas turbine units which are not connected to the national grid. The combined installed capacities of these plants added up to 224 MW in 2012/2013. Approximately 234.5 GWh of electricity were supplied to local users including tourist resorts.
Egypt is a net exporter of electricity, importing 77 GWh while exporting 474 GWh of electricity in 2012. In 2012/2013, the average percentage of network losses were 11.02%.
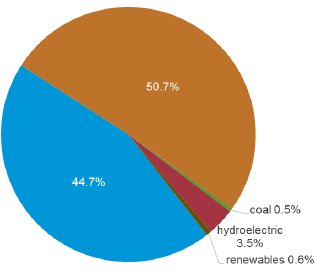
Between 2001 and 2012, electricity production rose from 83,282 GWh to 164,364 GWh. The main source for the production of electricity is gas (66%) followed by hydro (18.2%) and oil (15.6%). The Egyptian Electricity Holding Company (EEHC) operates with five-year plans. The current one (2012-2017) foresees the installation of 15.000 MW additional capacity. However, due to the increasing demand, the reserve margin is still expected to remain tight.
Consumption
The main consumer of electricity in Egypt is the residential sector which accounts for 42% of the total consumption, followed by the industrial sector (28%). The consumption of the residential sector has been steadily increasing in the recent years. According to the Ministry of Electricity and Energy, this is due to two factors: the expansion of residential compounds and new communities as well as the use of domestic appliances, air conditioners in particular, during hot weather. The development of the electricity consumption per sector is outlined in table 13.
Table 13: Electricity consumption by sector (GWh) 2008-2013
| Sector | 2008/2009 | 2009/2010 | 2010/2011 | 2011/2012 | 2012/2013 |
| GWh | |||||
| Industries | 37,273 | 38,916 | 40,702 | 42,098 | 39,887 |
| Agriculture | 4,617 | 4,834 | 4,927 | 5,560 | 6,230 |
| Utilities | 4,714 | 5,555 | 5,759 | 6,010 | 5,904 |
| Public lighting | 6,982 | 7,050 | 6,186 | 6,537 | 6,210 |
| Governmental entities | 5,563 | 5,443 | 5,977 | 6,385 | 7,664 |
| Residential | 43,811 | 47,431 | 51,370 | 56,664 | 59,757 |
| Commercial & others | 8,754 | 9,674 | 10,238 | 10,715 | 14,605 |
| Total | 111,714 | 118,903 | 125,159 | 133,969 | 140,257 |
Grid
In 2012/2013, the carrier grid consisted of 43,634 km total transmission lines and cables. The grid is subdivided into six geographical zones, namely Cairo, Canal, Delta, Alexandria and West Delta, Middle Egypt and Upper Egypt. The country’s entire territory is covered. The network is interconnected with the grids of Libya, Jordan, Syria, and Lebanon. There are ongoing studies for interconnections with Saudi Arabia, Sudan, the Democratic Republic of Congo, the Eastern Nile Basin (Sudan and Ethiopia) and Greece.
Table.14: Indicators of Egyptian Grid
| Category | Installed Capacity | Max Load | Transmission Grid | Generated Energy |
|---|---|---|---|---|
| Indicator | 45192 MW | 30400 MW | 45000 Km | 186320 GWh |
Electricity prices
The prices of electricity in Egypt range among the lowest in the world. The prices are fixed by the Egyptian and are highly subsidized. The tariff structure varies according to the type of consumption (i.e. residential, commercial, industrial) and amount consumed. Since the tariff is higher for higher consumption, there is an incentive to consume less. The lowest category of the residential tariff, up to 50 KWh/month, has remained unchanged since 1993 at 5 piasters per KWh.
Since 2007, the government has been trying to cut costs for subsidies. In July 2014, electricity prices were increased as part of a five-year plan which aims to start generating profits from electricity, which is currently sold for less than half its production cost.
